For this tutorial, I am assuming your are using the Universal Analytics version of Google Analytics. You can verify information in this guide by following along with Google’s official documentation. Fair warning Google sunsets features and changes layouts constantly and doesn’t reflect the most up-to-date user interface like me.
Access the Goals Dashboard
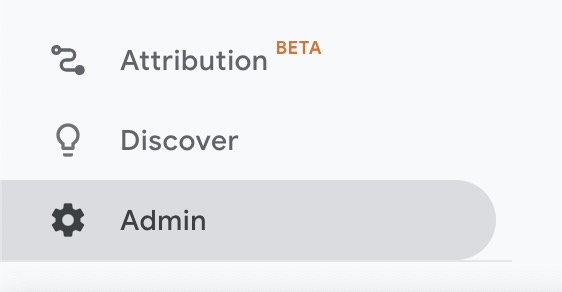
First, open your Analytics Property then navigate to the admin section by selecting the gear icon in the bottom left corner:
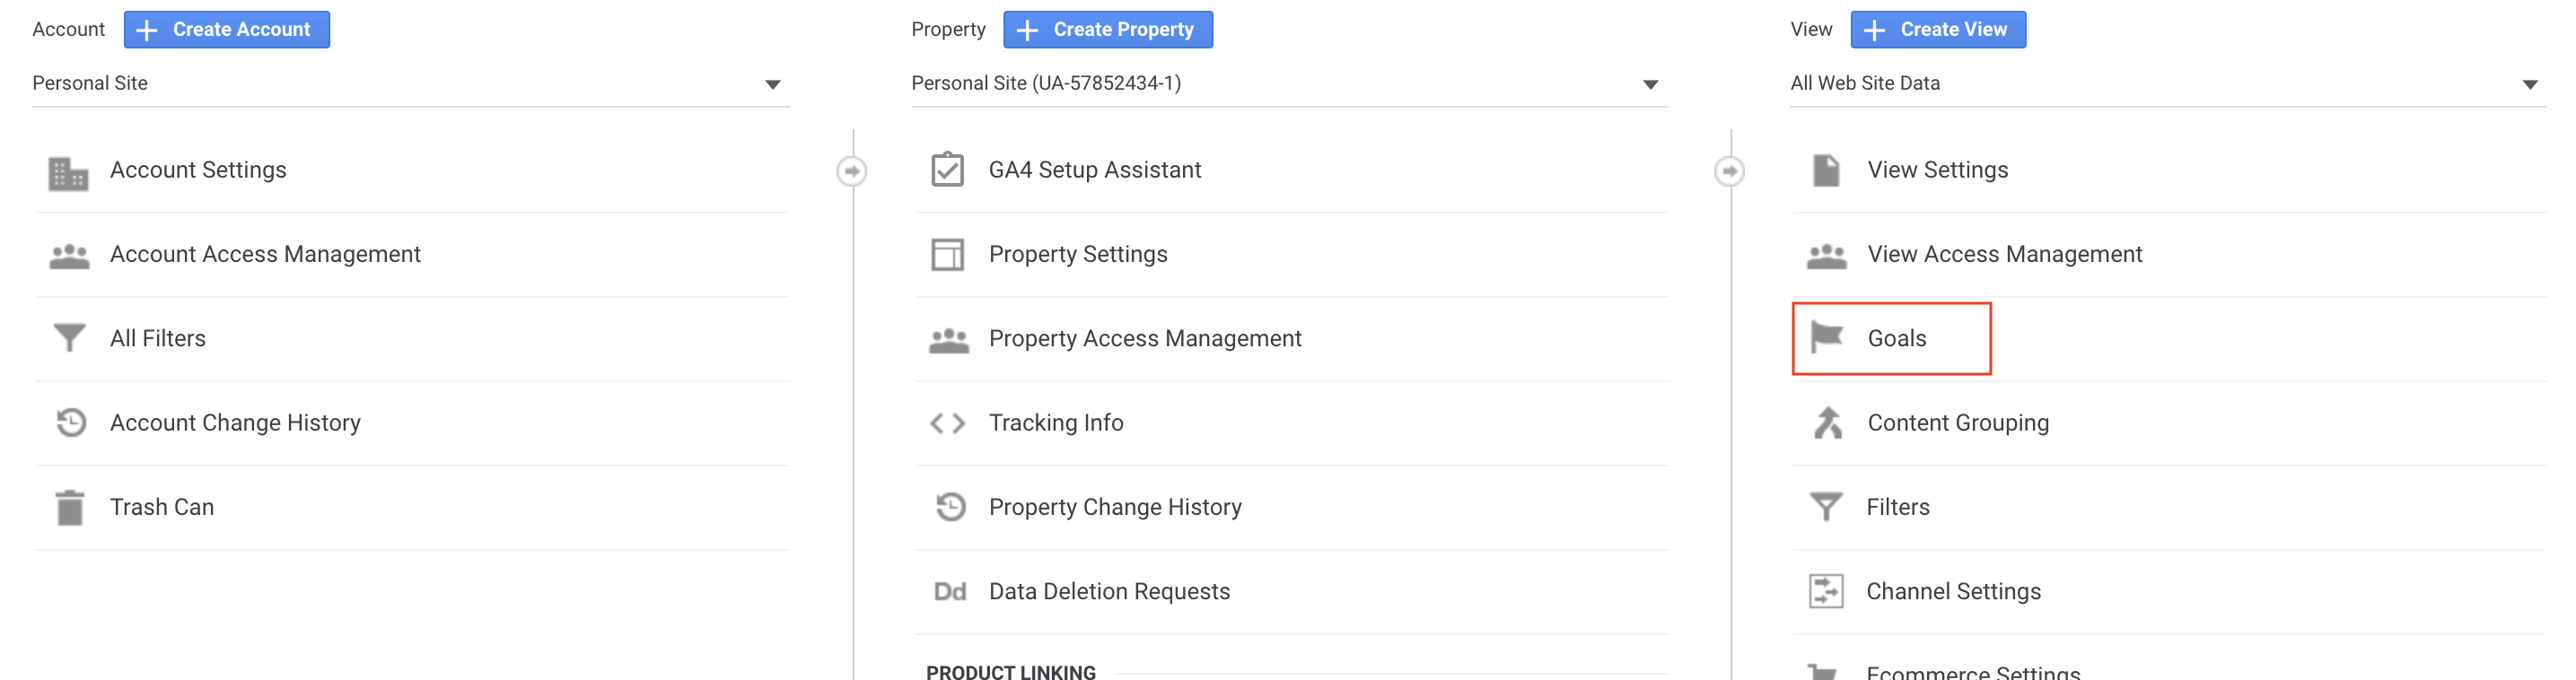
Now that you are in the Admin dashboard, select the Goals link in the View column:
Add a New Goal
With the Goal’s dashboard open, select the New Goal button:

Give your goal a Name that you can easily know what it is. I track submissions to my form and the conversion is aptly named “Form Submission”
Next, select a Goal slot ID. It should automatically select a free slot for you. This is helpful in grouping together your goals into views. So if you want to cluster conversions around certain user conversion flows, you can keep them all the in the same set. This will be helpful for viewing the Goals all in one place in your Analytics.
Select Goal Type
Here’s the tricky part: you will need to select a type. The type will determine how you will set up your Goal.
Destination
For most novices, I will suggest using the Destination Type. Let’s say you have a confirmation page after a user submits a form or purchases a product.
Once you determine your goal page users will end up on, enter the full URL into the Destination field with Equals to selected in the dropdown:
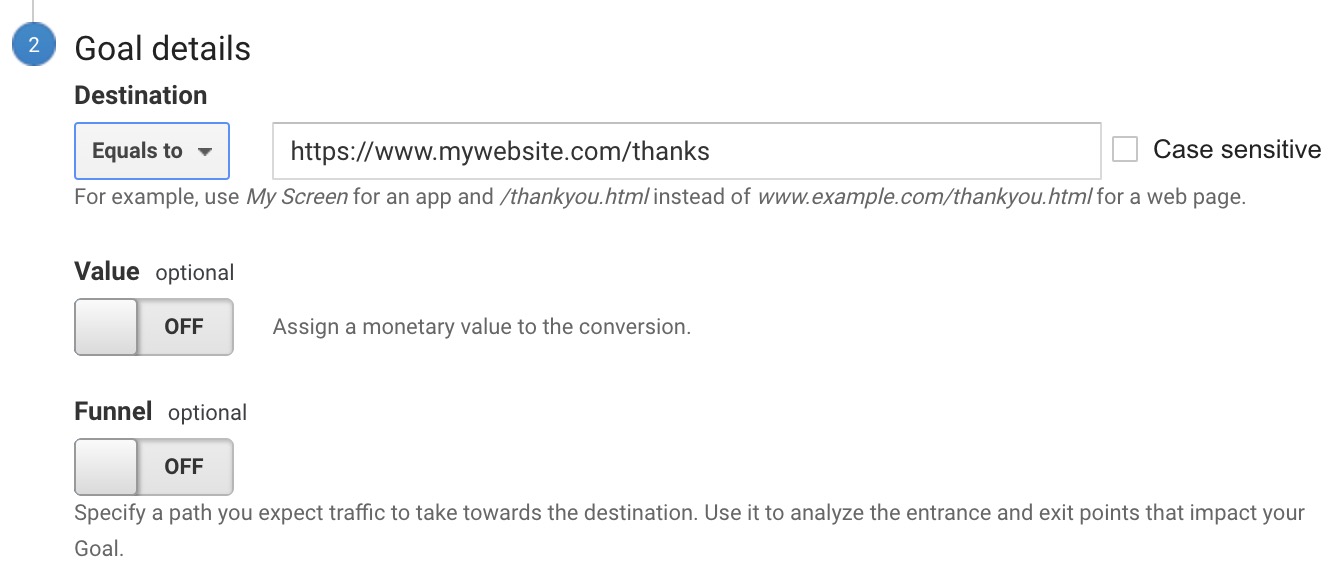
Google has full documentation on all the possibilities and parameters for entering a Destination goal URL, but you are not a computer science graduate and you just want to know how many people signed up for your newsletter on a Saturday so I suggest using the full URL (example: https://www.mywebsite.com/thanks) like I demonstrated above.
Leave Value and Funnel in the off position, then select Save and you’re all set.
Test your Event
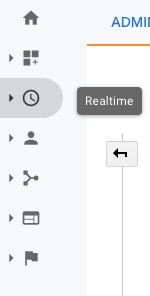
Now that you have your event set up, select the Clock icon for the Realtime Report:
Select the Events option in the dropdown that appears below the Realtime Report menu:

You should now see a live report of your site. You can also select Events (Last 30 min) to see what happened before.
Open a separate window or use your phone to view your website. Navigate to the page that you are triggering the event on and watch the realtime report.
You should see the event populate under in the table:
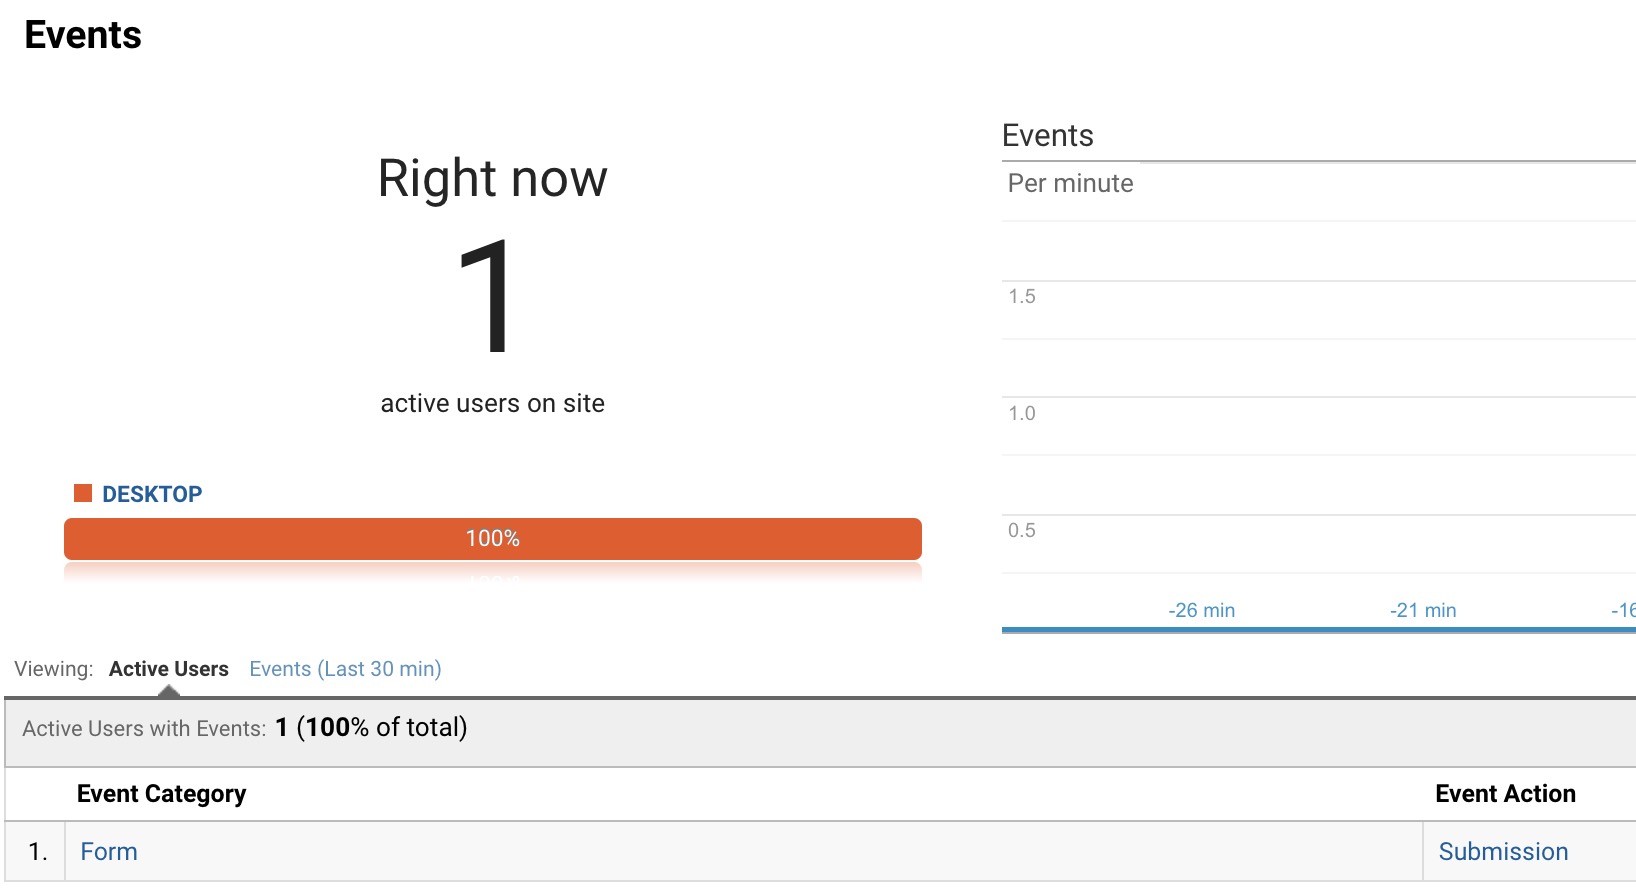
If you want to check the label, select the link in the Category column.
If you are not seeing the event populate, here are some trouble shooting tips:
Check the URL in the Goal Set
This sounds silly, but it has tripped up the best of us. Google is looking for that EXACT url so if your URL uses http and you typed in https you could be in error. If there’s an extra slash at the end, that could trip you up as well. Just make sure it’s the exact URL.
Make sure you’re using the right browser
Firefox does not allow tracking software on its browser so make sure you’re using either Chrome, Safari, or Edge. Incognito and private windows block traffic as well so make sure you’re using a regular window with any privacy settings disabled.
Use 4G service on your phone
Your web developer could have blocked your office’s IP from getting tracked on Google Analytics. It’s helpful so everyone working on the site doesn’t skew your data, but in this case, you are testing your tracking. Using the 4G network on your will put you on a different IP address so you will be tracked.
Check the Last 30 Minutes report
I mentioned this earlier: You can select the Events (Last 30 mins) right next to the Active Users tab in order to see events that occurred in the last 30 minutes. Google’s Active Users report is for users actively viewing the site and it will time out after a wee bit. The other option is to wait 24 hours is see the previous day’s report which we will get into next.
View the Conversions Report
Now that your conversion is set up and functioning properly, let’s get into the data.
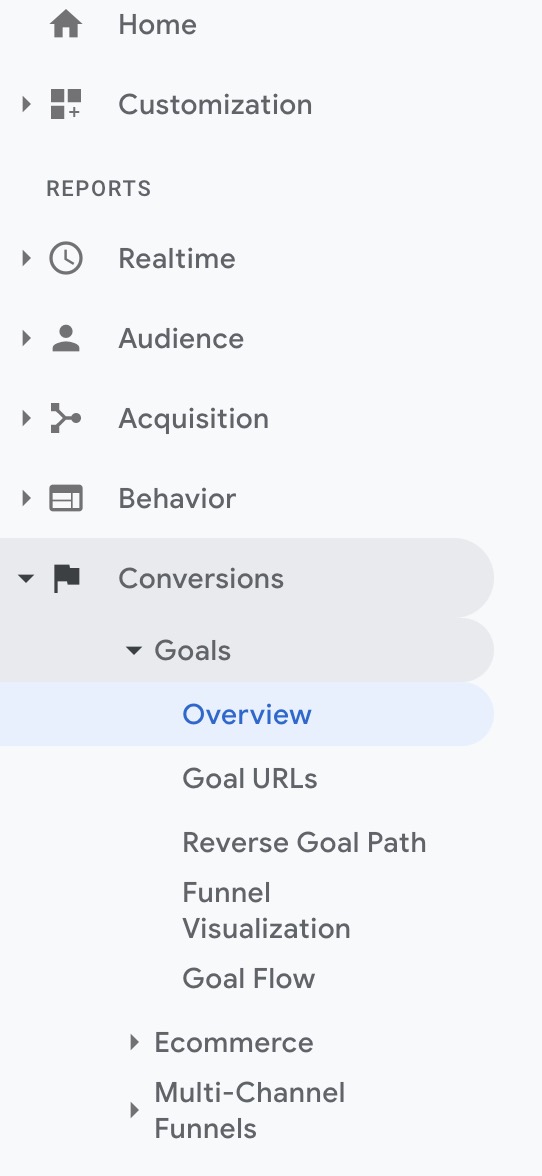
Select Conversions from the left-hand menu, then select Goals > Overview from the dropdown:
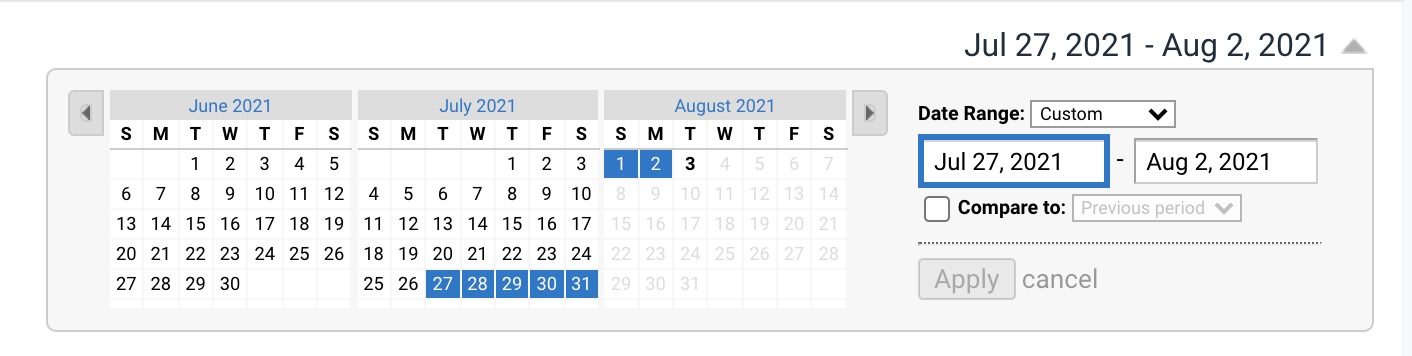
From here you can see all of the Goal completions of the past week.
You can change the date range by selecting the date range in the top-right corner:
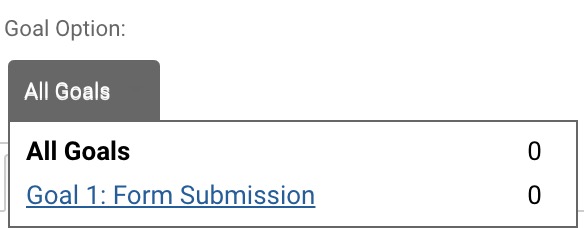
You can narrow down the Goals if you set up multiple, in the top-left corner of the report:
Outside of Overview, the Reverse Goal Path view is helpful to see the pages users viewed before converting.
Here’s some other helpful reports and how to get to them so see your conversions:
Behavior > Site Content > Landing Pages
See where users who converted started their journey on your website. This can be helpful to determining what pages on your site are performers and which ones have room for improvement
Acquisition > All Traffic > Channels, Source/Medium, Referrals
See a more drilled down view of how people are coming to your site and where they are most likely to convert from in order to determine what channels are most successful.